

The association measures monthly, depending on depth, the temperature, conductivity, oxygen concentration, and chlorophyll concentration of the water, using a multiparameter probe. The transparency of the surface layers is measured using the Secchi disk.
Once a year, during the period of maximum lake water mixing (between mid-February and mid-March), water samples are collected at various depths for chemical analysis. This analysis is conducted by the limnological laboratory of the Water Research Institute, CNR-IRSA in Verbania (Pallanza), one of the best in Italy.
The association regularly provides information on these activities on its website, in the Monitoring section.
The last multiparameter monitoring with sampling was conducted on March 3, 2026. The results of all recent monitoring activities allow us to update the framework described in the press release issued at the end of September 2025 and in the trophic level report.
Overall, the negative trend of deterioration in the ecological status is confirmed.
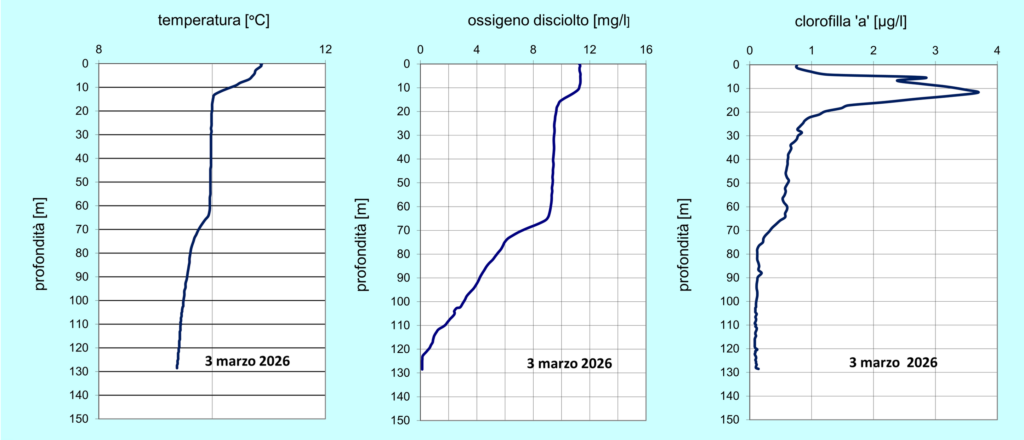
Graph 1: Vertical profiles of temperature, dissolved oxygen concentration and chlorophyll ‘a’ concentration measured with the multiparameter probe on March 3, 2026.
For the fourth consecutive year, winter mixing of the waters was only very partial, far from complete. This is confirmed by the highly inhomogeneous distribution of dissolved substances—including oxygen (see Graph 1), phosphorus (see Graph 2), nitrates, sulfates, etc.—and suspended substances such as chlorophyll (Graph 1) contained in phytoplankton.
In the case of complete mixing, the concentration of all these substances would be the same at all depths.
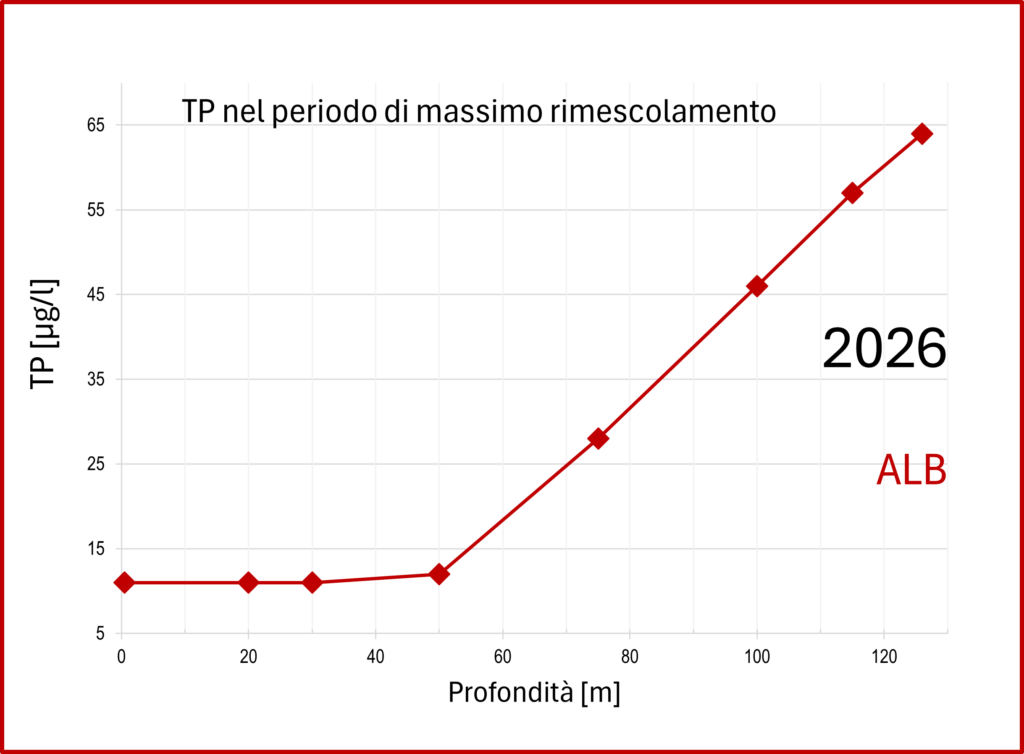
Graph 2: Total phosphorus (TP) concentration as a function of depth in samples taken on March 3, 2026.
The weighted mean concentration of total phosphorus in the lake increased to 23.5 µg/l (see Graph 3 for the evolution of this concentration from 2004 to 2026).
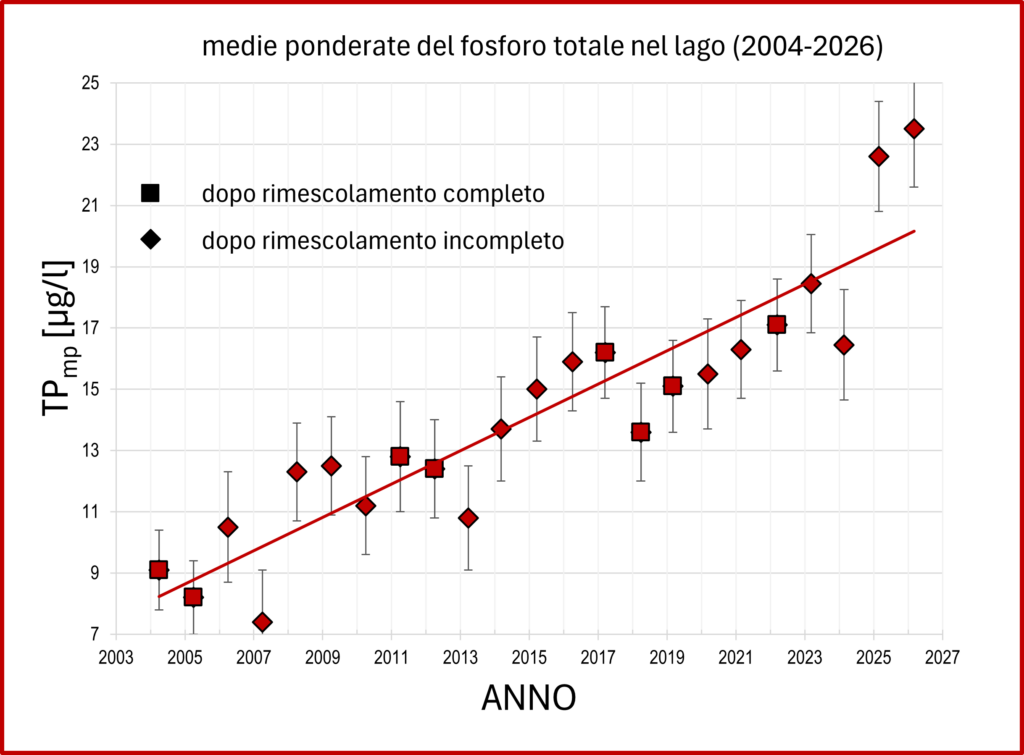
Graph 3: Evolution of weighted means of total phosphorus concentration from 2004 to 2026.
The weighted mean concentration of dissolved oxygen in the deep layers during the period of maximum stratification confirms the trend toward deoxygenation (see Graph 4).
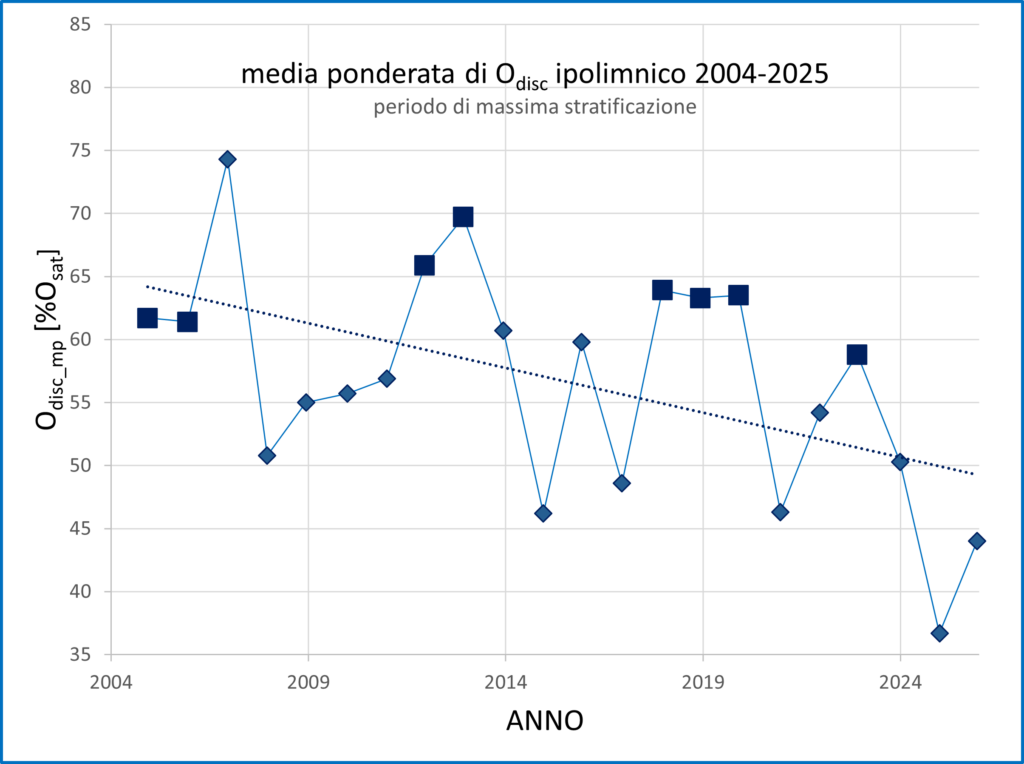
Graph 4: Weighted average concentration of dissolved oxygen in the hypolimnion, during the period of maximum stratification, from 2004 to the end of 2025.
Particularly concerning is the anoxia present in the layer of water in contact with the sediments (Graph 5), which – this is bad news—still has a thickness of more than ten meters at the beginning of March 2026.
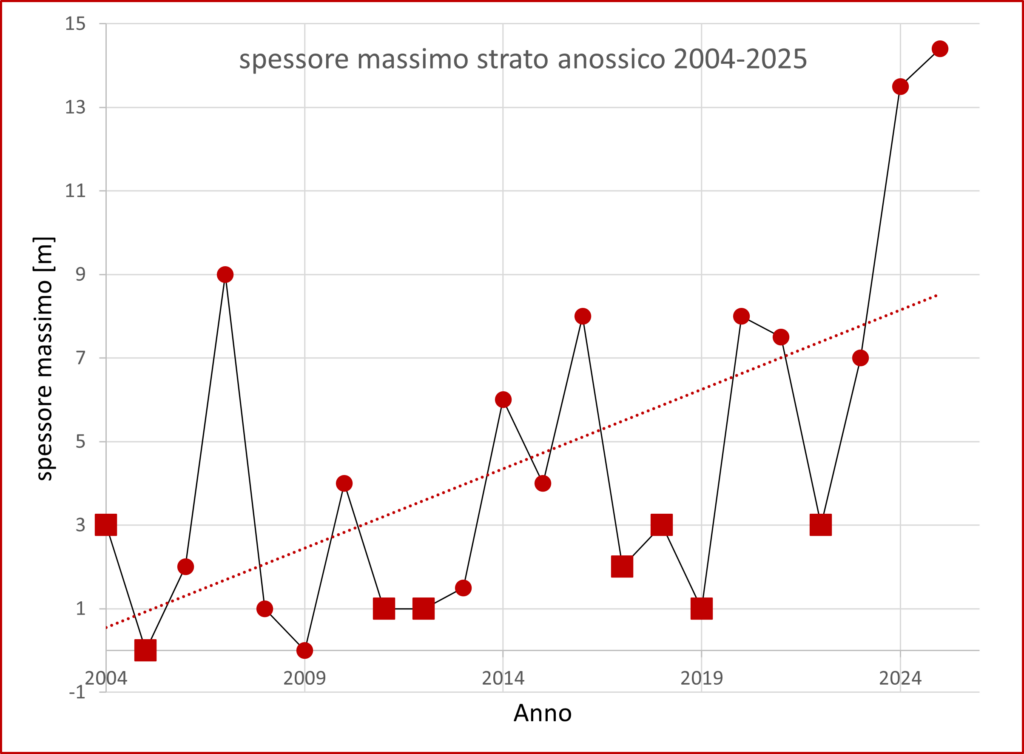
Graph 5: Maximum thickness of the anoxic layer, from 2004 to 2025.
In conclusion, these data indicate that the trophic status of Lake Bolsena can currently be classified as only “sufficient”, continuing its trend to degradation.
We are discussing with various experts the possible ecological and environmental consequences of the negative trend highlighted and the appropriate course of action. We’ll keep you informed!

